Complex Energy System Models and Data Structures
About
Energy system analysis models are complex and require an extensive hardware and software infrastructure, which will be developed, maintained and integrated in the newly established Complex Energy System Models and Data Structures group. Hardware and software requirements are defined and sustainable processes and software architectures developed, designed and implemented to enable efficient use and collaborative development among the model developers of the various teams. Furthermore, artificial intelligence-based techniques will be implemented to increase the accuracy of the power system models. Selected models developed at the institute will be deployed as applications in the working group and provided with graphical user interfaces to potentially interested parties.
Research Topics
Research topics include sustainable model development, focus and development of acceleration methods, research data management, and development of high value user interfaces.
Contact
Team Members


RESEARCH AREA
Sustainable Model Development

The development, implementation, and support of the models for energy system analysis are performed internally using JuGit and are partially published as open source. The team supports the collaborative development of the models and ensures their quality and sustainability, with automatic testing routines and adequate documentation.
The models are computed using the institute's internal high-performance cluster (CAESAR). The cluster contains 56 nodes, divided into three partitions for differing applications:
- 25 CPU heavy nodes with a total of 600 cores for parallel simulation and optimization purposes.
- 21 Ram heavy nodes with 2 or 4 TB Ram each for very large optimization models of the institute, for example global scale analyses.
- 10 GPU heavy nodes with a total of 80 GPUs for machine-learning methods of the institute.
Furthermore, the METIS project is part of collaboration with the Jülich Super Computing Center (JSC) in order to optimize the energy system models using supercomputers.

Acceleration Process
Incorporating large amounts of data is a particular challenge for power system analysis models, as they are generally based on optimization problems whose complexity increases disproportionately to the number of variables and constraints considered. This is a natural hurdle to the maximum level of detail that can be achieved with these models.
For this reason, acceleration methods are being systematically developed, implemented, and validated that permit the incorporation of ever higher resolution datasets into ever larger models. These include, on the one hand, mathematical procedures such as decomposition, which allow parallelized iterative solutions to be modeled and, on the other, the development of heuristics that reduce the resolution of models in those areas where high resolution does not provide added information value. Examples of these techniques include spatial and temporal aggregation, i.e., grouping together regions and time steps considered by the models that do not significantly differ from each other.
The figure below illustrates an example of the impact of aggregation on time series as they enter energy system models. A data reduction of more than 99% between the profiles on the upper left and the lower right is apparent, without a loss of the similarity between the two profiles.

Research Data Management
Within the framework of research data management, methods are being developed to improve the discoverability, accessibility, interoperability, and reusability of research data in accordance with the FAIR principles. In addition to classic result outputs, such as journal publications, data collections, or software models, supplementary outputs, such as presentations, documentation, code, video tutorials, and digital process workflows, are also being taken into account. In order to make the research data sustainably usable and efficiently exchangeable with the research community, metadata formats are being developed that are specially adapted to the needs of energy system analysis and include, amongst other things, information on data provenance and licensing regulations.
Within the framework of externally-funded projects such as LOD-GEOSS and NFDI4Ing, distributed database structures and semantic knowledge graphs are being established which, as integrating interfaces, support the research area in the development of a common research data infrastructure. At the same time, the Open Energy Ontology initiative is being created as a common language basis for promoting scientific exchange and increasing the degree of automation and efficiency of energy system analysis through the machine-readable formalization of domain-specific concepts and contexts.

User Interfaces
Graphical user interfaces (GUIs) offer the advantage of making data analysis more intuitive and easier to read and understand. They typically provide users with immediate visual feedback on the impact of each action. Our GUIs are primarily aimed at decision-makers who are involved in the Institute's projects and therefore want the easiest possible access to project results. These GUIs were created using the latest web technologies and powerful programming languages, allowing for smooth handling of the elements and making practical decisions in the shortest possible time. They are hosted on the in-house servers of IT Services.
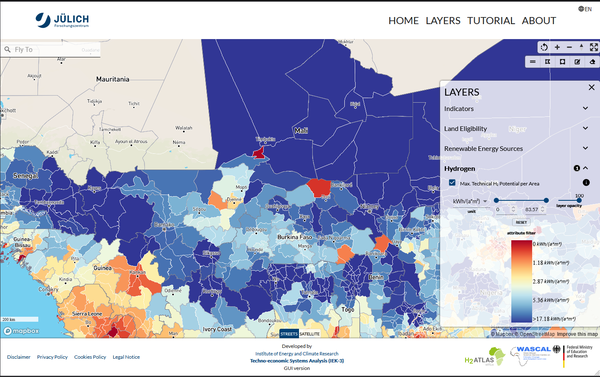
The Hydrogen Atlas Africa, a GUI recently developed by the Institute, is an example of a web software that offers an analysis of hydrogen potential in Africa. It is a web atlas that quickly identifies suitable areas for the construction of wind farms, solar parks, and hydrogen production plants, thus enabling decision-making information for the development of a hydrogen infrastructure.
Last Modified: 22.02.2024